import pandas as pd
import numpy as np
import os
import matplotlib.pyplot as plt
from pycaret.time_series import *
from datetime import datetime, timedelta
from statsmodels.tsa.stattools import adfuller
def load_stock_data(file_path):
df = pd.read_csv(file_path, parse_dates=['Date'], index_col='Date')
df = df.asfreq("D")
return df[['Close', 'Open', 'High', 'Low', 'Volume']]
def add_technical_indicators(data):
# 移動平均
data['MA7'] = data['Close'].rolling(window=7).mean()
data['MA30'] = data['Close'].rolling(window=30).mean()
# RSI
delta = data['Close'].diff()
gain = (delta.where(delta > 0, 0)).rolling(window=14).mean()
loss = (-delta.where(delta < 0, 0)).rolling(window=14).mean()
rs = gain / loss
data['RSI'] = 100 - (100 / (1 + rs))
# ボリンジャーバンド
data['20MA'] = data['Close'].rolling(window=20).mean()
data['20SD'] = data['Close'].rolling(window=20).std()
data['Upper_BB'] = data['20MA'] + (data['20SD'] * 2)
data['Lower_BB'] = data['20MA'] - (data['20SD'] * 2)
return data
def check_stationarity(data):
result = adfuller(data['Close'].dropna())
if result[1] > 0.05:
data['Close'] = data['Close'].diff().dropna()
print("データを差分変換して定常性を確保しました")
return data
def predict_stock_price(data, stock_name):
original_data = data.copy()
data = check_stationarity(data)
data = add_technical_indicators(data)
data = data.dropna(axis=1,how="all")
setup(data=data["Close"],
target='Close',
fold=3,
n_jobs=-1,
use_gpu=True,
numeric_imputation_target="ffill",
numeric_imputation_exogenous="ffill"
# numeric_features=['Open', 'High', 'Low', 'Volume', 'MA7', 'MA30', 'RSI', 'Upper_BB', 'Lower_BB']
)
best_model = compare_models(n_select=2)
blended_model = blend_models(best_model)
final_model = finalize_model(blended_model)
future_dates = pd.date_range(start=data.index[-1] + timedelta(days=1), periods=60)
predictions = predict_model(final_model, fh=60)
if 'Close' in data.columns and data['Close'].iloc[0] != data['Close'].diff().iloc[0]:
predictions['y_pred'] = predictions['y_pred'].cumsum() + original_data['Close'].iloc[-1]
print(f"\n予測結果 for {stock_name}:")
print(predictions)
predictions.to_csv(f'./prediction_data/{stock_name}_predictions.csv')
return original_data, predictions
def is_price_increasing(current_price, predicted_price):
return predicted_price > current_price
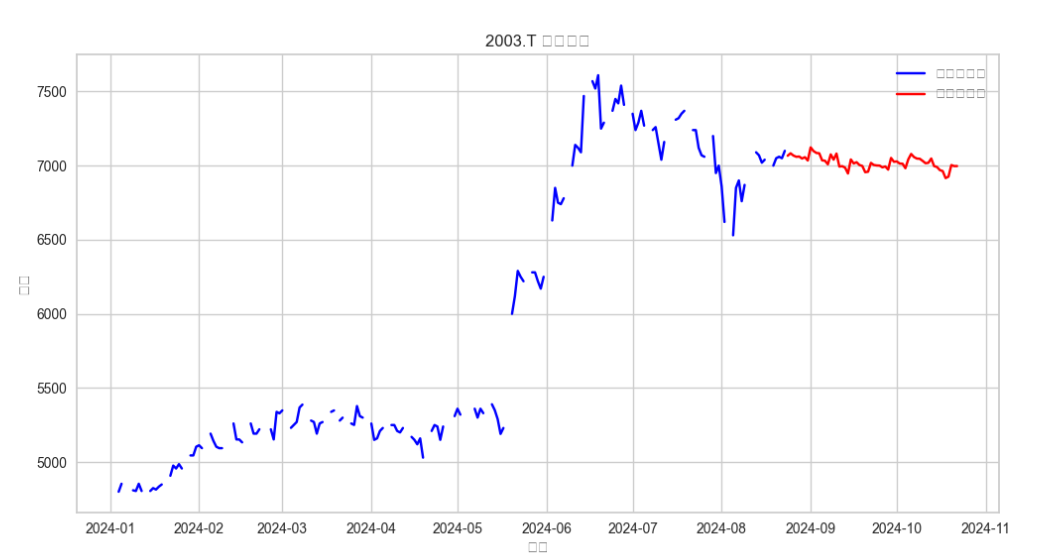
def plot_stock_data(past_data, predictions, stock_name,is_increasing):
plt.figure(figsize=(12, 6))
plt.plot(past_data.index, past_data['Close'], label='過去データ', color='blue')
plt.plot(predictions.index, predictions['y_pred'], label='予測データ', color='red')
plt.title(f'{stock_name} 株価予測')
plt.xlabel('日付')
plt.ylabel('株価')
plt.legend()
plt.grid(True)
plt.savefig(f'./prediction_data/{stock_name}_prediction_plot_{str(is_increasing)}.png')
plt.close()
def main():
stock_data_dir = './stock_data'
for file_name in os.listdir(stock_data_dir):
if file_name.endswith('.csv'):
file_path = os.path.join(stock_data_dir, file_name)
stock_name = os.path.splitext(file_name)[0]
print(f"\n処理中: {stock_name}")
stock_data = load_stock_data(file_path)
current_price = stock_data['Close'].iloc[-1]
past_data, predictions = predict_stock_price(stock_data, stock_name)
final_predicted_price = predictions['y_pred'].iloc[-1]
is_increasing = is_price_increasing(current_price, final_predicted_price)
print(f"\n{stock_name}の現在の株価: {current_price:.2f}")
print(f"{stock_name}の予測最終日の株価: {final_predicted_price:.2f}")
print(f"{stock_name}の株価は上昇すると予測: {is_increasing}")
plot_stock_data(past_data, predictions, stock_name,is_increasing)
print(f"{stock_name}の予測プロットを保存しました: {stock_name}_prediction_plot.png")
if __name__ == "__main__":
main()